
|
Temperature  9,5°C |
Wind  SW SW3 Bft Gentle breeze 14,4 km/h |
Rainfall today 9,2 mm |
Humidity  100% |
Pressure  Rising Slowly 1008,5 hPa |
Air Quality  20 |
|
Cloud Base ± 0 m |
Cloud cover

Precipitateradar
Thunderstorms

24/7 Weathercamera
Natural Fire Risk


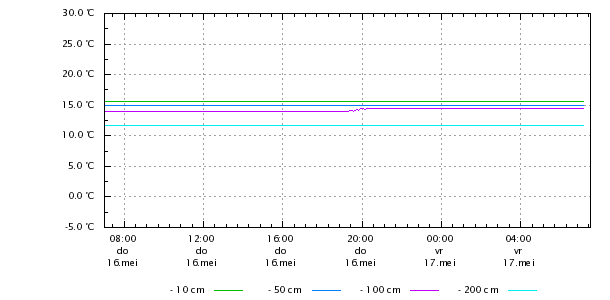
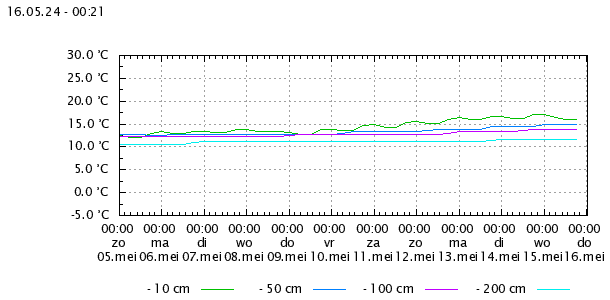
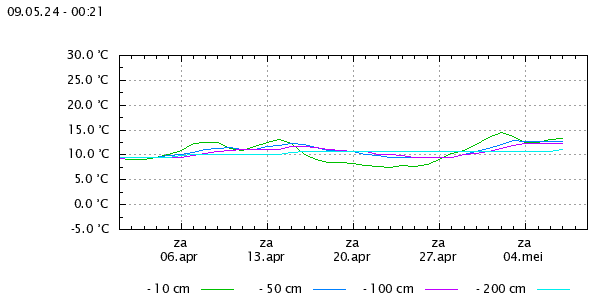
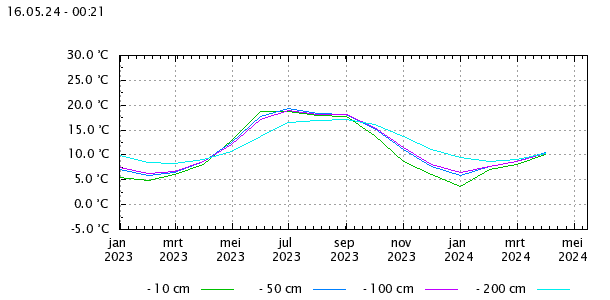
Soil-sensors: Background information
We have soil sensors buried in the ground at the levels indicated below.
Each level has a temperature probe and a moisture sensor.
Current Planting & Watering Guide
| Depth in cm |
Moisture - cb | Temperature - °C | ||||||
| Min | Max | Actual | Grow conditions | Actual | Max | Min | ||
| 10 | 17 | 22 | 18 | Adequate (11 - 26cb) | Minimum growth (10 - 15°C) | 14 | 15 | 1 |
| 50 | 24 | 200 | 200 | Dangerous Dry (101 - 240cb) | Minimum growth (10 - 15°C) | 13 | 13 | 4 |
| 100 | 13 | 19 | 20 | Adequate (11 - 26cb) | Minimum growth (10 - 15°C) | 12 | 12 | 4 |
| 200 | 21 | 46 | 40 | Irrigation desired (26 - 61cb) | Minimum growth (10 - 15°C) | 11 | 11 | 8 |
Explanation Soil condition
Water potential is commonly measured in units of bars (and centibars in the English system of measurement) or kilopascals (in metric units).
One bar is approximately equal to one atmosphere (14.7 lb/in 2 ) of pressure. One centibar is equal to one kilopascal.
| Buttton text | Explanation |
|
Saturated
(0 - 11cb) |
Saturated Soil. Occurs for a day or two after irrigation. |
|
Adequate
(11 - 26cb) |
Soil is adequately wet (except coarse sands which are drying out at this range) |
|
Irrigation desired
(26 - 61cb) |
Usual range to irrigate or water (except heavy clay soils). Irrigate at the upper end of this range in cool humid climates and with higher water-holding capacity soils. |
|
Irrigation needed
(61 - 101cb) |
Usual range to irrigate heavy clay soils |
|
Dangerous Dry
(101 - 240cb) |
Soil is becoming dangerously dry for maximum production. |
| Records | |||||||||||||
| Depth in cm |
This month | This year | All time | ||||||||||
| Date | Min | Max | Date | Date | Min | Max | Date | Date | Min | Max | Date | ||
| Soil Temperatures | |||||||||||||
| 10 | 01-05 | 13.3 | 15.6 | 02-05 | 11-01 | 1.1 | 15.0 | 01-05 | 04-12-2016 | 0.0 | 26.7 | 04-08-2018 | |
| 50 | 01-05 | 10.6 | 13.3 | 02-05 | 16-01 | 3.9 | 12.8 | 15-04 | 09-05-2016 | 0.0 | 23.9 | 05-08-2018 | |
| 100 | 01-05 | 10.6 | 11.7 | 02-05 | 21-01 | 4.4 | 11.7 | 15-04 | 20-11-2017 | 0.0 | 23.3 | 06-08-2018 | |
| 200 | 01-05 | 10.6 | 10.6 | 01-05 | 26-01 | 8.3 | 10.6 | 01-01 | 23-02-2017 | 0.0 | 19.4 | 11-08-2018 | |
| Soil Moisture | |||||||||||||
| 10 | 01-05 | 17.0 | 19.0 | 02-05 | 02-01 | 17.0 | 22.0 | 11-01 | 10-12-2016 | 0.0 | 255.0 | 01-12-2016 | |
| 50 | 01-05 | 200.0 | 200.0 | 01-05 | 23-04 | 24.0 | 200.0 | 29-04 | 11-12-2016 | 9.0 | 200.0 | 29-04-2024 | |
| 100 | 02-05 | 16.0 | 20.0 | 03-05 | 01-01 | 13.0 | 19.0 | 21-01 | 20-11-2017 | 1.0 | 255.0 | 20-11-2017 | |
| 200 | 02-05 | 21.0 | 42.0 | 02-05 | 07-02 | 21.0 | 46.0 | 04-01 | 28-11-2017 | 15.0 | 125.0 | 23-02-2017 | |
Ground graphics: -10cm -50cm -100cm -200cm
Day graphic
Week graphic
Month graphic
Year graphic
You find our weather info also at:
|
|
|
|
|
|
|
|
|
|
|


")


")
Equipment we use:
Hardware supplier |
Weather-station |
WeatherServer's |
WeatherProgram's |
Satellite NOAA's |
Satellite Eumetsat |
Lightning detector |
Provider |
|
|
|
|
|
|
|
|


17 user(s) online | Your comments and questions are valued | Your IP: 3.145.36.10
This website is maintained on a voluntary basis, using the information at your own risk !!!

